Chiaroscuro

A New Privacy-Preserving Solution for Clustering Massively Distributed Personal Times-Series

Work in progress …


Discover

Benefiting from the Wealth of Personal Time-Series on Personal Devices

An ever-increasing amount of data is expected to be generated at the individual side (e.g., wearables, smart-meters) (i) often as time-series and (ii) stored on a personal device for being analyzed and vizualized.

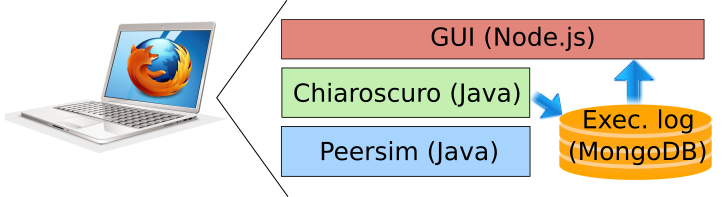
Chiaroscuro1 aims at:

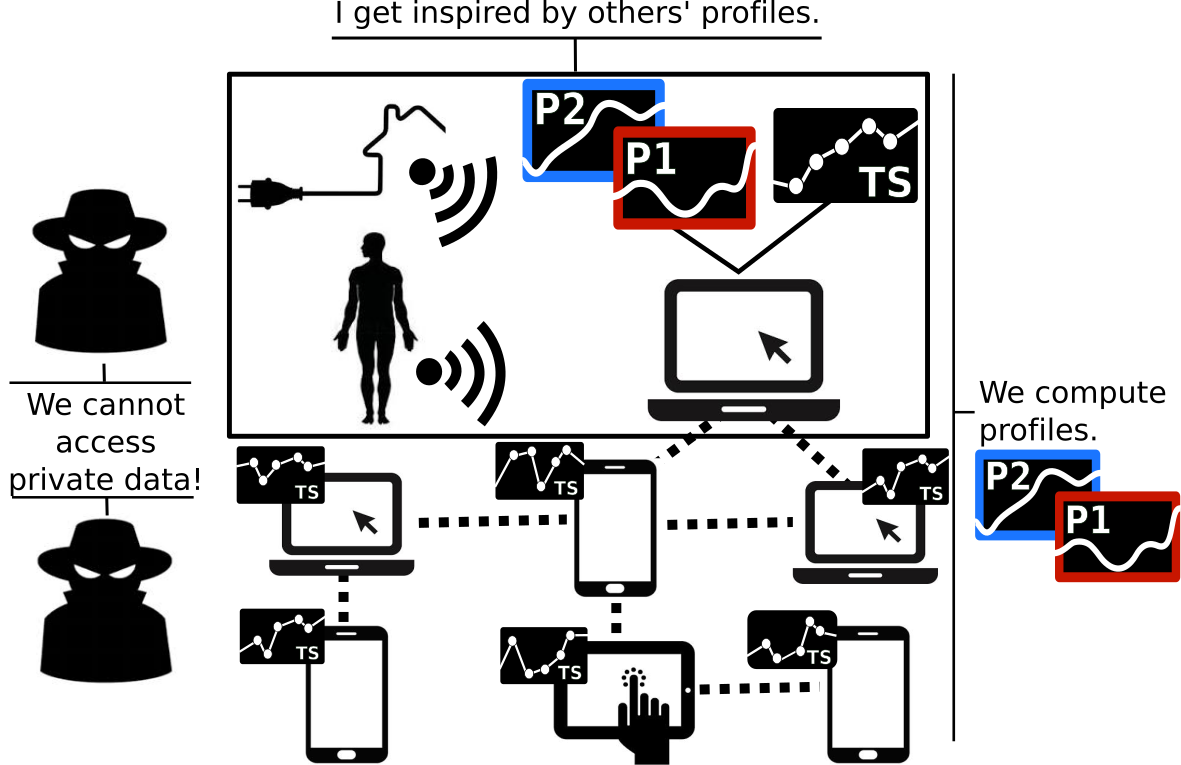
  • Extracting representative profiles
  • From a set of time-series distributed over a large number of personal devices (massive populations)
  • Without jeopardizing individuals' privacy

Chiaroscuro avoids two major common obstacles to personal data analytics.It does not copy the personal time-series on any central server (no information about a personal time-series leaves in a non-protected form its personal host devices). And it does not use any prohibitively-costly cryptographic protocol for extracting the profiles.

Chiaroscuro rather promotes an innovative approach that discloses perturbed agregate information all along the execution sequence by intertwining encryption schemes with sanitization schemes.


Chiaroscuro
Fig1. - Chiaroscuro Approach.

References

1. T. Allard, G. Hébrail, F. Masseglia, and E. Pacitti, "Chiaroscuro: Transparency and privacy for massive personal time-series clustering," in Proceedings of the 2015 ACM SIGMOD International Conference on Management of Data, SIGMOD ’15. ACM, 2015, pp. 779–794. Available here.


At the Crossroad of Three Technologies

Clustering

k-Means algorithm: iterative computation of groups of similar time-series. Representative profiles are the centroids.

Learn More

Massive distribution

Gossip-based modus operandi: simple point-to-point exchanges for robust and efficient agregate computation.

Learn More

Privacy

Homomorphic encryption & probabilistic differential privacy: obfuscation for simple operations & disclosures for the rest.

Learn More

Platform

Chiaroscuro has been implemented within Peersim1 a well-known framework for simulating massively-distributed algorithms. The graphical user interface (that you are currently reading!) reads the logs of a set of previous executions and allows you :

  1. To choose the values of the mutable parameters, defining thus a scenario
  2. To visualize a variety of information about the execution of the scenario chosen
  3. To interact with the result of the clustering performed by Chiaroscuro

Since the simulation is executed on a single computer, we had to shrink the number of participants to a few hundreds (i.e., the shrinkFactor parameter) and to disable the encryption scheme. This impacts the simulation as follows: first, the noise magnitude is shrunk too in order to remain proportional to the shrunk population size, second, the performances of the encryption scheme are measured outside the simulation.

Platform

Fig2. - Demonstration Platform.

Figure 2 depicts the demonstration platform. Chiaroscuro is written in Java and implements Peersim's nextCycle method by the core of its execution sequence. This method is the same for all participants and is the entry point for Peersim each time it calls a participant. The graphical user interface is based on Node.js and can be displayed in any web browser. It allows visualizing and interacting with the logs of the execution scenarios that have previously been captured and stored in a local MongoDB instance.

References

1. A. Montresor and M. Jelasity, “PeerSim: A scalable P2P simulator,” in P2P, 2009, pp. 99–100.


Fixed Parameters

Parameter Value
shrinkFactor 5000
Population size 3.106 / shrinkFactor = 600 participants
Key size 1024 bits

Mutable Parameters

Work in progress…

Epsilon

Smoothing

Strategy


In this use-case, each times-series represents the evolution of a tumor size over twenty weeks, with one measure per week. Computing representative profiles can help individuals or health professionals identify profiles where the tumor size decreases, healthy profiles in some sense, in order to analyze then the associated medicines or life-styles for example. The set of time-series was generated synthetically from mathematical models1.

References

1. L. Claret, M. Gupta, K. Han, A. Joshi, N. Sarapa, J. He, B. Powell, and R. Bruno. Evaluation of tumor-size response metrics to predict overall survival in western and chinese patients with first-line metastatic colorectal cancer. J. Clin. Onc., 31(17):2110–2114, 2013.

Visualize: Evolution of Profiles along the k-Means Iterations

Four participants are sampled at random. We plot for each iteration, their own time-series with the closest perturbed centroid.

Current iteration : #0


Interact: What Can Bob Do with the Result?

Any individual obtaining the resulting set of common profiles, possibly helped by a user-friendly GUI, can use them for identifying those of particular interest. For example, in the tumor-growth use-case, Bob could benefit from the profiles that show an initial growth similar to his own time-series, but that is followed then by a steady decrease in size.

We show below the time-series of participant #213, say Bob, together with the profiles that are the closest to the sub-sequence that falls into the window (in grey). You can play with the window to select the sub-sequence that is used for similarity-matching. Extending the profiles matching with additional criterion is easy (e.g., largest distance with the complementary sub-sequence).


Visualize: Impact of Noise

We illustrate the impact of the perturbation on the centroids quality by showing below the first four centroids, (1) at each iteration (2) before and after adding noise. We stress that we show them for illustrative purposes, the noise values never appear in the clear to any participant.


Visualize: Performances of the encryption scheme


Work in progress (the figures below come from the experiments in the paper)…

Encryption cost of a set of cleartext means (50 time-series)

Decryption cost of a set of encrypted means (50 time-series)

Homomorphic addition cost of two sets of encrypted means (50 time-series)

Research and Prototype


Tristan Allard (Principal Investigator)
Univ. Rennes 1 / Irisa Lab
Website
Georges Hébrail
EDF Lab
Website
Florent Masseglia
Inria
Website
Esther Pacitti
Univ. Montpellier / Lirmm Lab
Website


Graphical User Interface


Matthieu Simonin
SED @Inria Rennes
Website
Charly Maupetit
SED @Inria Rennes
Website